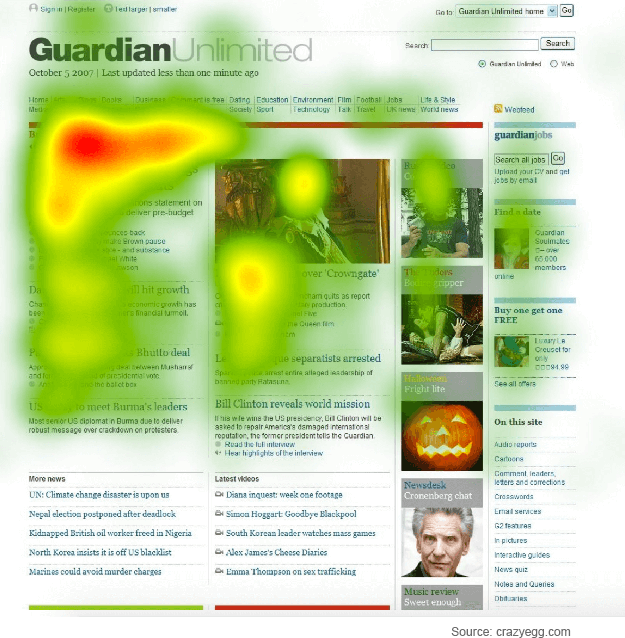
While website analytic tools like Site Catalyst and Google Analytics provide various metrics, they lack details to help you comprehend how users are behaving on your site. This is where heatmaps help. They provide you with visualization of how users engage with your web pages. You can use the valuable insights derived therefrom to boost customer experience and customer engagement. This blog tells you how.
But before that, let’s get into the basics.

What are heatmaps?
Heatmaps are data analytic tools that simplify and visualize a large amount of website data. It visualizes data using a color scheme that ranges from red to blue on your website itself. You get reports of customer behavior in terms of their mouse hovering, clicking, scrolling, and even user-session recordings. Some good tools like NotifyVisitors provide real-time analytics reporting of this info.

Looking at your website’s heatmap, you get an idea of those pages that most visitors are spending their time on, the places where they are clicking on, to what extent they scroll down each page, and the places where they are hovering their mouse on. You can also get to know more about average user interaction time, website drop-offs, form submission attempts, left blanks in forms, and more.
Equipped with this information, you can find ways to improve your website to boost customer engagement. This can also, therefore, be employed as one of your prime customer retention strategies.
5 Ways to use heatmaps to boost customer engagement
You can effectively use the information gained from heatmaps to make your site appealing and useful. This can improve customer engagement, boost customer loyalty, and increase customer lifetime value. Here are five ways in which you can use heatmaps to achieve these.
1. Get to know if visitors are seeing crucial content

When you analyze your heatmaps, one of the vital things you should look for is whether visitors are paying enough attention to your site’s content. Here are some tips in this regard-
- The content on your homepage’s “above the fold” area is what users see first as soon as they land on your site. This is what they read before deciding whether or not to scroll down or move to the other pages of your site. So, find out if this is captivating your audience. If not, consider re-writing it.
- Identify those pages that are read a lot by your users. Analyze those to understand what makes them interesting for users. Use these insights to improve your other areas too.
- Find out if users are navigating your site the way you intend it, if not consider rearranging your pages accordingly. This way they will take the user journey to increase conversions.
2. Find if visitors are experiencing issues across devices
Find how your site’s heatmaps are differing across browsers, screen sizes, and devices. You’ll find that visitors on older browsers or mobile devices have experiences that are quite different from that of visitors on the latest versions of browsers or laptops.
To prevent losing these users, your site should provide a seamless and engaging experience across all devices, browsers, and screen resolutions. Since more users are using mobile devices nowadays, start with your site’s mobile version.
Look at your heatmap to know if users only visit your home screen and then leave your site. If this is the case, find out ways to make it organized, clean, and user-friendly for these users.
3. Identify ways to improve your site’s usability
Another way in which you can boost customer engagement via heat mapping is by improving your site’s design and content structure. The common website elements which attract visitors to use them are your ads, banners, buttons, thumbnails, listings, etc.
Often you may wonder how many viewers viewed these elements and how many of them clicked through or interacted with them. The analysis of the former is referred to as content impression and that of the latter as content interaction.
You can look at your heatmaps to know the number of impressions and the percent of interactions that a site element received. For instance, if you find that a button with a high impression received low interactions, you know something is wrong with the button. Maybe its CTA, color scheme or content needs to be modified to make it attractive. This way, you can optimize your website elements to improve its usability.
4. Determine the ideal length of web pages
Usually, the top part of a page would have been viewed by most visitors and hence would be the “hottest”. As you move down, the heatmap shows lower user engagement with the page.
By analyzing your scroll heatmap, you’ll get to know what percentage of visitors have scrolled down to each part of the page. This will help you-
- Recognize the regions on your web page where visitors are engaging the most and where they are losing interest. This way, you can identify what holds the interest of your audience and what doesn’t impress them.
- Identify the average length of a webpage beyond which users don’t scroll down. This will help you determine the ideal content length preferred by your users.
- Optimize the length of content on sales pages so that your entire message and sales pitch get read by your users.
5. Discover distracting elements
Often when you look at your site’s heatmaps, you’ll find that certain elements are distracting your audience from the main content. For instance, the positioning of ads, graphics, or something else near the CTA may be diverting them from reading your content and taking a favorable action. By optimizing these, you can increase click-through rates and engagement rates.
You may also discover that your visitors are trying to click through some non-clickable items. In such cases, you may provide a link that leads them to an informative or useful piece of content. This in turn can increase your website conversions.
Final thoughts
Heatmaps can give you insights that aren’t readily available from other analytics tools. You can also combine heat mapping with A/B testing to understand which elements need to be A/B tested. As long as they are used properly, and inferences aren’t derived from small quantities of data, heatmaps can be a successful tool to analyze your website to make it ideal for boosting customer experience and engagement.


